OK.Wahl
Internetpräsentation
Version 2.2.7
Ergebnis zur Landtagswahl 2013 am 15.09.2013
Stimmkreis Wunsiedel, Kulmbach - Landkreis Kulmbach - Gemeinde Harsdorf
Es wurden alle Stimmbezirke ausgewertet.
 Diagramm
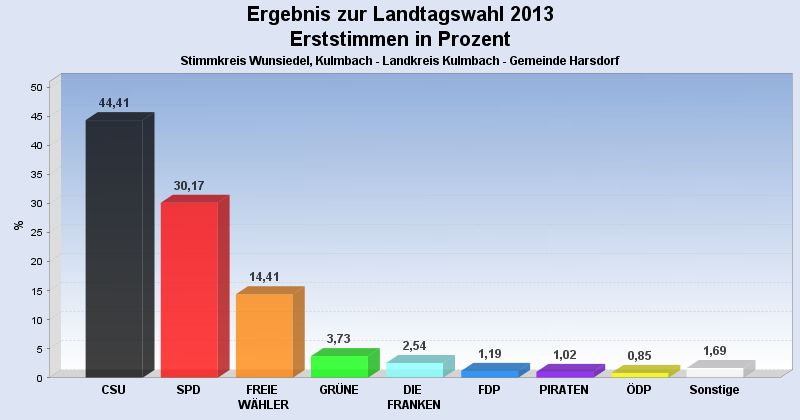
 Seitenanfang
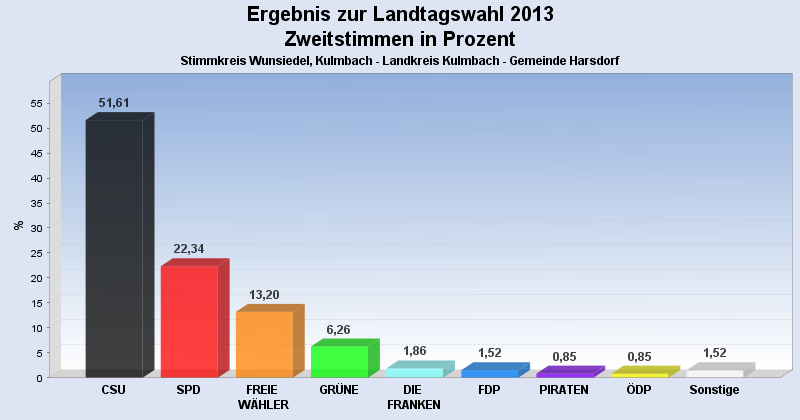
Wahlbeteiligung, Stimmzettel, Stimmen
| Wahlbeteiligung: | 72,82% |
|---|---|
| Stimmberechtigte: | 824 |
| Wähler: | 600 |
| Ungültige Erststimmen: | 10 |
| Gültige Erststimmen: | 590 |
| Ungültige Zweitstimmen: | 9 |
| Gültige Zweitstimmen: | 591 |
Erststimmen nach Wahlvorschlag
| Partei | Erststimmen | Prozent | |
|---|---|---|---|
| 1 | Schöffel, Martin ( CSU ) | 262 | 44,41% |
| 2 | Aures, Inge ( SPD ) | 178 | 30,17% |
| 3 | Baumgärtner, Martin ( FREIE WÄHLER ) | 85 | 14,41% |
| 4 | Artmann, Brigitte ( GRÜNE ) | 22 | 3,73% |
| 12 | Ludwig, Georg Dieter ( DIE FRANKEN ) | 15 | 2,54% |
| 5 | Nagel, Thomas ( FDP ) | 7 | 1,19% |
| 13 | Hanakam, Bernhard ( PIRATEN ) | 6 | 1,02% |
| 7 | Bittermann, Ehrenfried ( ÖDP ) | 5 | 0,85% |
| 6 | Meist, Christa ( DIE LINKE ) | 4 | 0,68% |
| 10 | Roppelt, Markus ( BP ) | 3 | 0,51% |
| 9 | Bestehorn, Harald ( NPD ) | 2 | 0,34% |
| 8 | Krause, Rainer ( REP ) | 1 | 0,17% |
Zweitstimmen nach Wahlvorschlag
| Partei | Zweitstimmen | Prozent | |
|---|---|---|---|
| 1 | CSU | 305 | 51,61% |
| 2 | SPD | 132 | 22,34% |
| 3 | FREIE WÄHLER | 78 | 13,20% |
| 4 | GRÜNE | 37 | 6,26% |
| 12 | DIE FRANKEN | 11 | 1,86% |
| 5 | FDP | 9 | 1,52% |
| 13 | PIRATEN | 5 | 0,85% |
| 7 | ÖDP | 5 | 0,85% |
| 6 | DIE LINKE | 5 | 0,85% |
| 9 | NPD | 2 | 0,34% |
| 8 | REP | 1 | 0,17% |
| 11 | FRAUENLISTE | 1 | 0,17% |
| 10 | BP | 0 | 0,00% |
- Stand: 19.09.2013 10:56:41