OK.Wahl
Internetpräsentation
Version 2.2.7
Ergebnis zur Landtagswahl 2013 am 15.09.2013
Stimmkreis Wunsiedel, Kulmbach - Landkreis Wunsiedel i. Fichtelgebirge - Stadt Kirchenlamitz
Es wurden alle Stimmbezirke ausgewertet.
 Diagramm
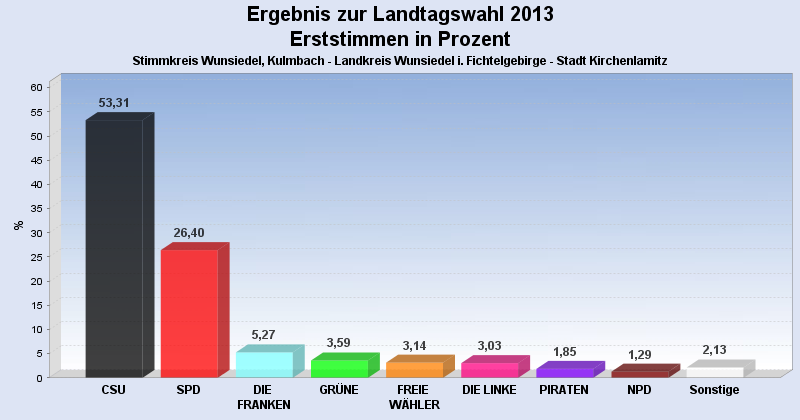
 Seitenanfang
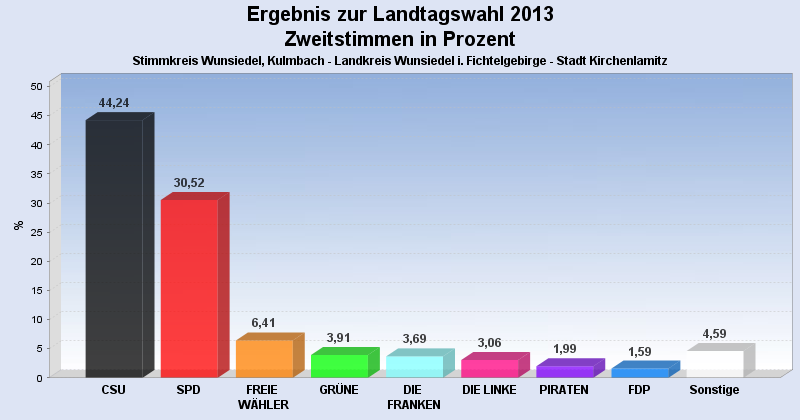
Wahlbeteiligung, Stimmzettel, Stimmen
| Wahlbeteiligung: | 66,47% |
|---|---|
| Stimmberechtigte: | 2.708 |
| Wähler: | 1.800 |
| Ungültige Erststimmen: | 16 |
| Gültige Erststimmen: | 1.784 |
| Ungültige Zweitstimmen: | 37 |
| Gültige Zweitstimmen: | 1.763 |
Erststimmen nach Wahlvorschlag
| Partei | Erststimmen | Prozent | |
|---|---|---|---|
| 1 | Schöffel, Martin ( CSU ) | 951 | 53,31% |
| 2 | Aures, Inge ( SPD ) | 471 | 26,40% |
| 12 | Ludwig, Georg Dieter ( DIE FRANKEN ) | 94 | 5,27% |
| 4 | Artmann, Brigitte ( GRÜNE ) | 64 | 3,59% |
| 3 | Baumgärtner, Martin ( FREIE WÄHLER ) | 56 | 3,14% |
| 6 | Meist, Christa ( DIE LINKE ) | 54 | 3,03% |
| 13 | Hanakam, Bernhard ( PIRATEN ) | 33 | 1,85% |
| 9 | Bestehorn, Harald ( NPD ) | 23 | 1,29% |
| 5 | Nagel, Thomas ( FDP ) | 13 | 0,73% |
| 10 | Roppelt, Markus ( BP ) | 11 | 0,62% |
| 8 | Krause, Rainer ( REP ) | 11 | 0,62% |
| 7 | Bittermann, Ehrenfried ( ÖDP ) | 3 | 0,17% |
Zweitstimmen nach Wahlvorschlag
| Partei | Zweitstimmen | Prozent | |
|---|---|---|---|
| 1 | CSU | 780 | 44,24% |
| 2 | SPD | 538 | 30,52% |
| 3 | FREIE WÄHLER | 113 | 6,41% |
| 4 | GRÜNE | 69 | 3,91% |
| 12 | DIE FRANKEN | 65 | 3,69% |
| 6 | DIE LINKE | 54 | 3,06% |
| 13 | PIRATEN | 35 | 1,99% |
| 5 | FDP | 28 | 1,59% |
| 10 | BP | 27 | 1,53% |
| 9 | NPD | 19 | 1,08% |
| 11 | FRAUENLISTE | 15 | 0,85% |
| 8 | REP | 13 | 0,74% |
| 7 | ÖDP | 7 | 0,40% |
- Stand: 19.09.2013 10:58:41