OK.Wahl
Internetpräsentation
Version 2.2.7
Ergebnis zur Landtagswahl 2013 am 15.09.2013
Stimmkreis Wunsiedel, Kulmbach - Landkreis Wunsiedel i. Fichtelgebirge - Markt Thierstein
Es wurden alle Stimmbezirke ausgewertet.
 Diagramm
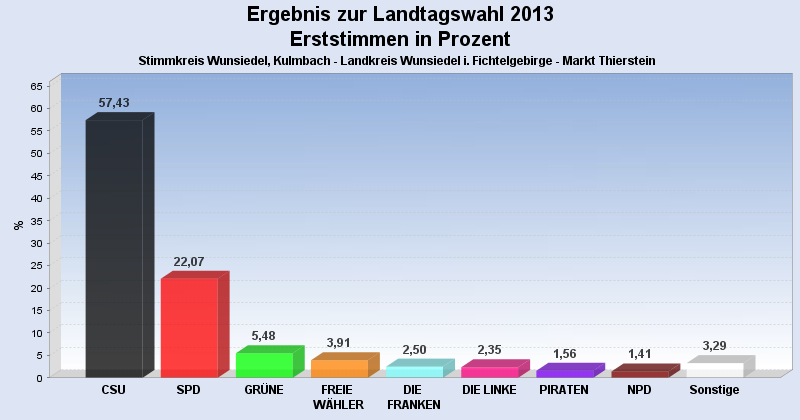
 Seitenanfang
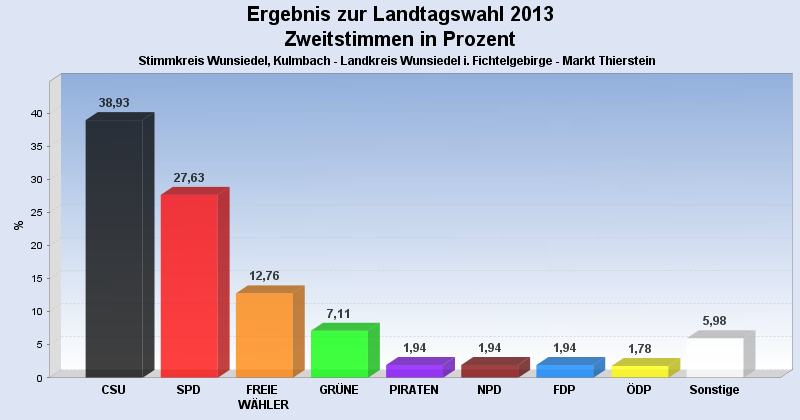
Wahlbeteiligung, Stimmzettel, Stimmen
| Wahlbeteiligung: | 67,75% |
|---|---|
| Stimmberechtigte: | 952 |
| Wähler: | 645 |
| Ungültige Erststimmen: | 6 |
| Gültige Erststimmen: | 639 |
| Ungültige Zweitstimmen: | 26 |
| Gültige Zweitstimmen: | 619 |
Erststimmen nach Wahlvorschlag
| Partei | Erststimmen | Prozent | |
|---|---|---|---|
| 1 | Schöffel, Martin ( CSU ) | 367 | 57,43% |
| 2 | Aures, Inge ( SPD ) | 141 | 22,07% |
| 4 | Artmann, Brigitte ( GRÜNE ) | 35 | 5,48% |
| 3 | Baumgärtner, Martin ( FREIE WÄHLER ) | 25 | 3,91% |
| 12 | Ludwig, Georg Dieter ( DIE FRANKEN ) | 16 | 2,50% |
| 6 | Meist, Christa ( DIE LINKE ) | 15 | 2,35% |
| 13 | Hanakam, Bernhard ( PIRATEN ) | 10 | 1,56% |
| 9 | Bestehorn, Harald ( NPD ) | 9 | 1,41% |
| 7 | Bittermann, Ehrenfried ( ÖDP ) | 8 | 1,25% |
| 8 | Krause, Rainer ( REP ) | 7 | 1,10% |
| 5 | Nagel, Thomas ( FDP ) | 4 | 0,63% |
| 10 | Roppelt, Markus ( BP ) | 2 | 0,31% |
Zweitstimmen nach Wahlvorschlag
| Partei | Zweitstimmen | Prozent | |
|---|---|---|---|
| 1 | CSU | 241 | 38,93% |
| 2 | SPD | 171 | 27,63% |
| 3 | FREIE WÄHLER | 79 | 12,76% |
| 4 | GRÜNE | 44 | 7,11% |
| 13 | PIRATEN | 12 | 1,94% |
| 9 | NPD | 12 | 1,94% |
| 5 | FDP | 12 | 1,94% |
| 7 | ÖDP | 11 | 1,78% |
| 6 | DIE LINKE | 10 | 1,62% |
| 12 | DIE FRANKEN | 9 | 1,45% |
| 8 | REP | 7 | 1,13% |
| 10 | BP | 6 | 0,97% |
| 11 | FRAUENLISTE | 5 | 0,81% |
- Stand: 19.09.2013 10:59:59