OK.Wahl
Internetpräsentation
Version 2.2.7
Ergebnis zur Landtagswahl 2013 am 15.09.2013
Stimmkreis Wunsiedel, Kulmbach - Landkreis Wunsiedel i. Fichtelgebirge - Stadt Weißenstadt
Es wurden alle Stimmbezirke ausgewertet.
 Diagramm
 Seitenanfang
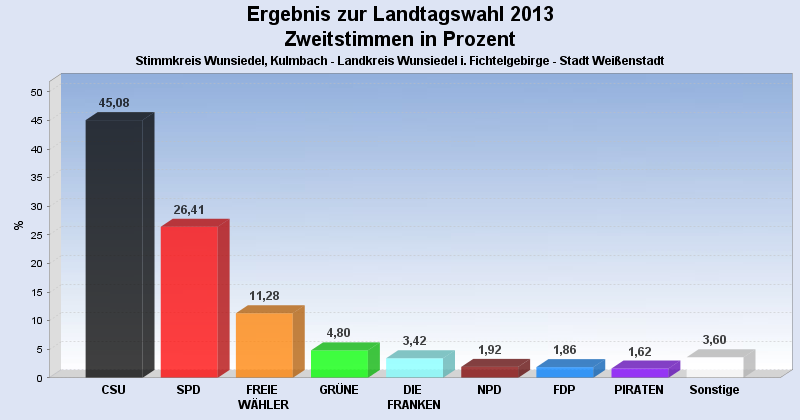
Wahlbeteiligung, Stimmzettel, Stimmen
| Wahlbeteiligung: | 63,79% |
|---|---|
| Stimmberechtigte: | 2.698 |
| Wähler: | 1.721 |
| Ungültige Erststimmen: | 18 |
| Gültige Erststimmen: | 1.703 |
| Ungültige Zweitstimmen: | 55 |
| Gültige Zweitstimmen: | 1.666 |
Erststimmen nach Wahlvorschlag
| Partei | Erststimmen | Prozent | |
|---|---|---|---|
| 1 | Schöffel, Martin ( CSU ) | 920 | 54,02% |
| 2 | Aures, Inge ( SPD ) | 450 | 26,42% |
| 3 | Baumgärtner, Martin ( FREIE WÄHLER ) | 87 | 5,11% |
| 4 | Artmann, Brigitte ( GRÜNE ) | 66 | 3,88% |
| 12 | Ludwig, Georg Dieter ( DIE FRANKEN ) | 53 | 3,11% |
| 9 | Bestehorn, Harald ( NPD ) | 30 | 1,76% |
| 5 | Nagel, Thomas ( FDP ) | 25 | 1,47% |
| 6 | Meist, Christa ( DIE LINKE ) | 25 | 1,47% |
| 13 | Hanakam, Bernhard ( PIRATEN ) | 16 | 0,94% |
| 8 | Krause, Rainer ( REP ) | 14 | 0,82% |
| 10 | Roppelt, Markus ( BP ) | 11 | 0,65% |
| 7 | Bittermann, Ehrenfried ( ÖDP ) | 6 | 0,35% |
Zweitstimmen nach Wahlvorschlag
| Partei | Zweitstimmen | Prozent | |
|---|---|---|---|
| 1 | CSU | 751 | 45,08% |
| 2 | SPD | 440 | 26,41% |
| 3 | FREIE WÄHLER | 188 | 11,28% |
| 4 | GRÜNE | 80 | 4,80% |
| 12 | DIE FRANKEN | 57 | 3,42% |
| 9 | NPD | 32 | 1,92% |
| 5 | FDP | 31 | 1,86% |
| 13 | PIRATEN | 27 | 1,62% |
| 6 | DIE LINKE | 20 | 1,20% |
| 8 | REP | 18 | 1,08% |
| 10 | BP | 11 | 0,66% |
| 7 | ÖDP | 6 | 0,36% |
| 11 | FRAUENLISTE | 5 | 0,30% |
- Stand: 19.09.2013 11:00:07